Sales are the lifeblood of any business, driving revenue and growth. Monitoring your sales department closely is crucial for success. Data is key to understanding your sales team’s performance. In this blog, we will explore how to create a sales dashboard that can help you track your sales activities and make informed decisions.
What is a Sales Dashboard?
A sales dashboard is a tool that visualizes sales data to track performance. It helps sales managers and executives make informed decisions by providing a clear view of key metrics. With a sales dashboard, you can quickly see how your sales team is performing and identify areas for improvement.
Why Your Business Needs a Sales Dashboard
Having a sales dashboard is essential for dynamic and competitive markets. It provides insights into revenue and sales performance, helping you identify opportunities and potential areas for improvement. By monitoring key metrics, you can ensure your sales team is on track to meet targets and drive business growth.
Key Metrics to Include
When creating a sales dashboard, it’s important to include key metrics such as:
- Revenue and Sales Targets: Track how well your team is meeting their goals.
- Sales Pipeline: Monitor the stages of your sales process and conversion rates.
- Regional Sales Performance: Understand how different regions are performing.
- Product-Wise Breakdown: See which products are driving the most sales.
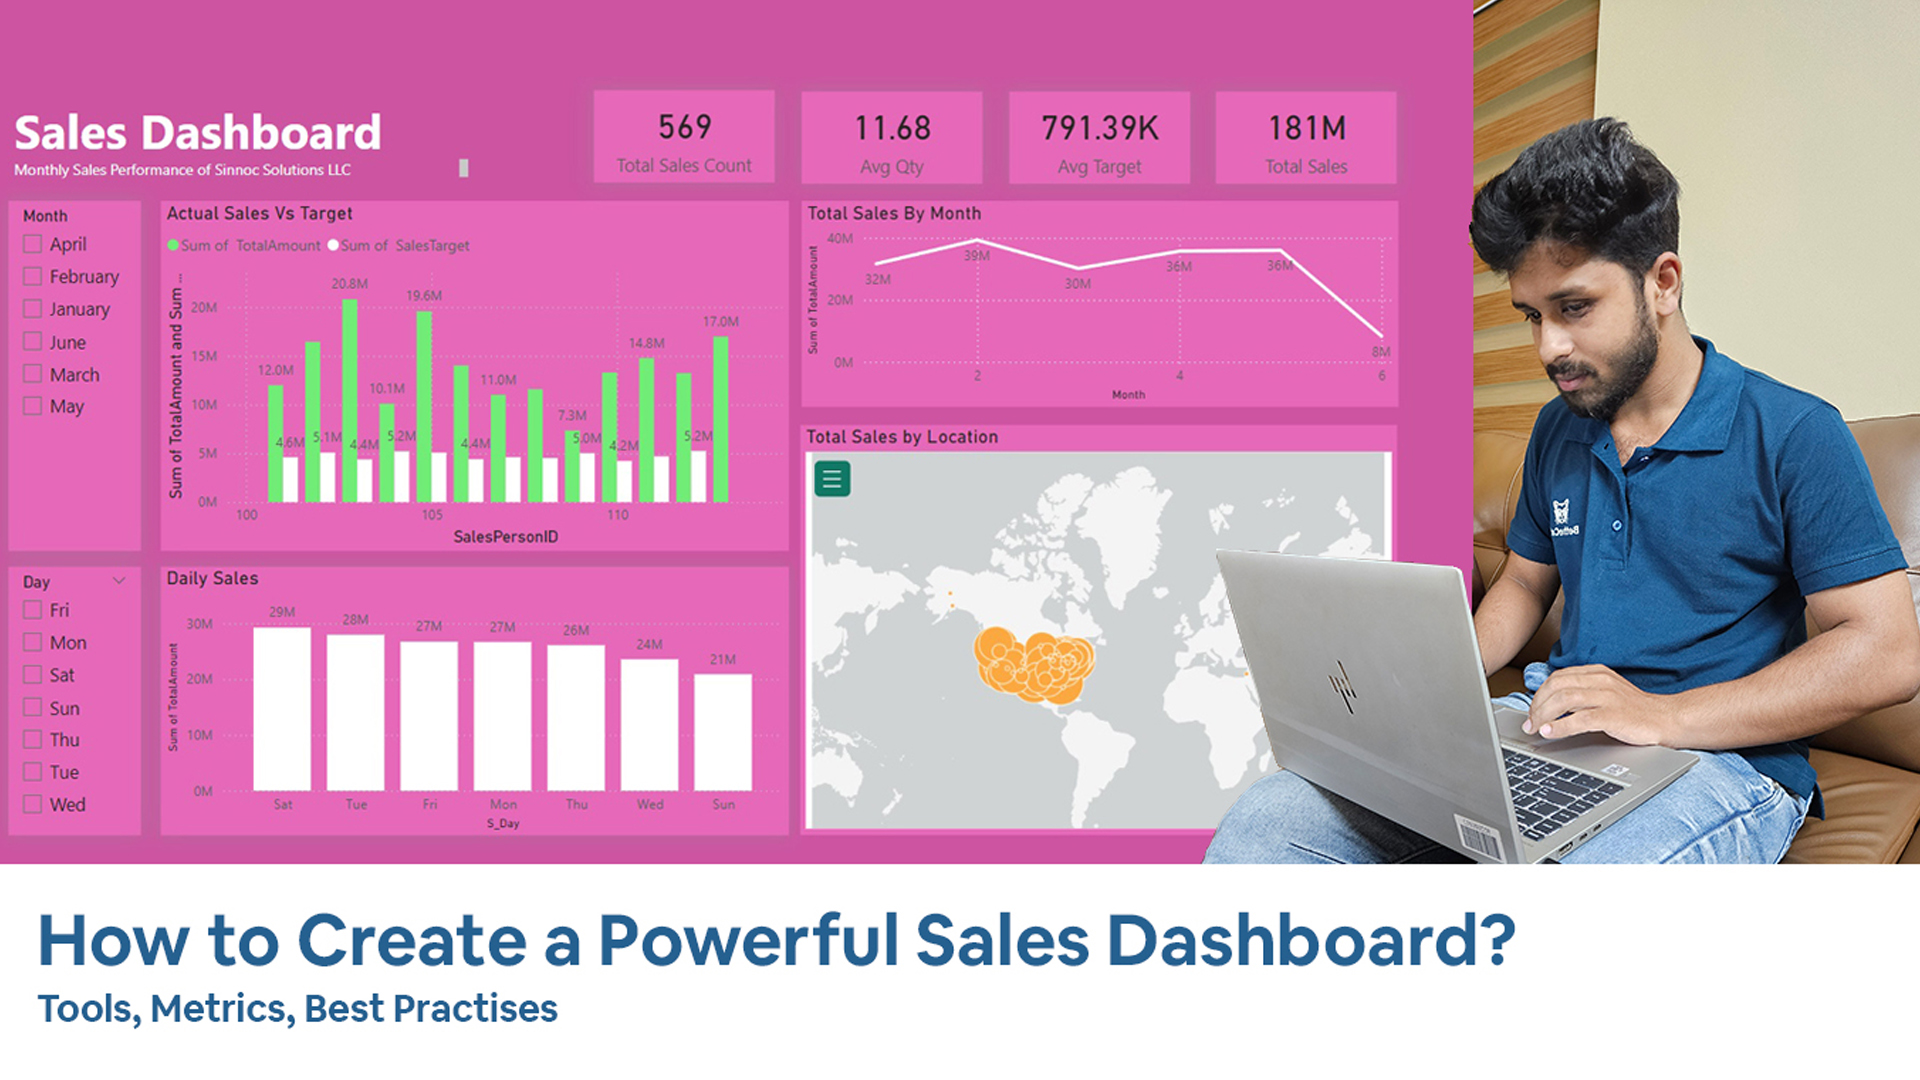
Metrics Used Here are Total Sales, Avg Sales, Sale Count, Target, Sales by each salesman against their target, Sales by location, Sales by Month, Sales by Day Along with Month and Day filter.
This help us to answer questions such as,
- Which are the high performing location?
- What’s the Sales Executive performance?
- Relation between Month/ Day vs sales, gives the seasonality.
NB: This’s a basic sales dashboard. The key metrics change according to the type of business/ product/ region etc.
Data Sources for Your Dashboard
To create an effective sales dashboard, you need accurate and consistent data from various sources: Basic tools including,
- ERP Systems and Accounting Software: These systems hold crucial sales data.
- CRM Tools: Manage customer relationships and track sales activities.
- SQL Databases and APIs: Integrate data from different sources for a comprehensive view.
- Custom Excel Sheets: Use Excel to manage and visualize additional data.

Here I’ve created multiple measures, vlookups, tables relationship etc. to connect different data sources.
Choosing the Right Tools
There are several BI tools available for creating sales dashboards. Some of the popular ones include:
- Power BI: A user-friendly and powerful option for creating dynamic dashboards.
- Tableau: Known for its advanced data visualization capabilities. Good for large amount of data.
- Qlik Sense: Offers interactive data analytics.
Among these, MS Power BI is often considered the most adaptable and easy to use for creating sales dashboards.
Step-by-Step Guide to Create a Sales Dashboard
1. Identify Your Goals: Define what you want to achieve with your dashboard. Align it with your business objectives to ensure it meets your needs.
2. Gather and Integrate Data: Connect your data sources (ERP, CRM, Excel) to ensure accuracy and consistency. This step is crucial for reliable insights.
3. Design Your Dashboard: Choose a layout that highlights key metrics. Use charts, graphs, and tables for clear visualization of your data.
4. Implement and Test: Build the dashboard using your chosen BI tool. Test it thoroughly to ensure it meets your requirements and provides the insights you need.
Benefits of Using a Sales Dashboard
Improved Decision Making: With quick access to critical sales data, you can make data-driven decisions that drive business growth.
Enhanced Sales Performance: Identify top performers and areas needing improvement. Set realistic targets and track progress effectively.
Increased Efficiency: Automate data collection and reporting to save time and reduce manual effort, allowing your team to focus on selling.
Conclusion
A well-designed sales dashboard is essential for any business aiming to track and improve sales performance. By integrating data from various sources and using powerful BI tools, you can create a dynamic dashboard that helps you make informed decisions and drive growth. For more insights on BI tools and their impact on different business departments, check out our blog here. https://kapsights.com/blog
Related Posts

AI Digital Sales Assistant – How to increase online sales

How to use AI for managing Employee Queries?